Tutorials
Get started with OP3
Export options in OP3
OP3 allows you to export to different formats, mainly to visual formats and data formats. The visual formats include SVG, PDF and PowerPoint exports, while the data formats include Excel, CSV, Smartsheet and Google Sheets exports.
Visual Exports
All visual exports in OP3 are based on the SVG generation for the project. This is a high quality, vector based graphical representation of the project, and can be used anywhere, since it’s a well-established Web standard. OP3 doesn’t export to other image formats, like PNG or JPEG in order to maintain the quality of the design. You can export either to PDF or PowerPoint, both of which would generate PDF and PowerPoint files with the SVG representation of the entire project in it. The SVG is exported along with extra information appended on top of the page – Project Title and Date of Export. This is the default behavior of OP3, and currently there is no option available to configure this.

The visual exports are free, and don’t incur any credit charge.
Data Exports
These types of exports include Excel, Smartsheet and Google Sheets. In order to be able to export to Smartsheet or Google Sheets, you would first need to integrate your account with any of those services. Task groups and sub-task groups are exported as groups in the exact same definition order, so that you won’t lose the data context.
Exporting to Excel and Google Sheets is very straightforward, as shown in the following images.
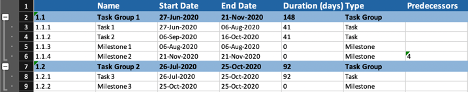
Excel Export
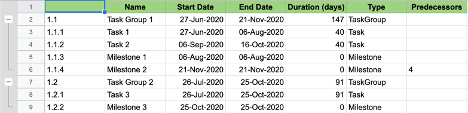
Google Sheets Export
Exporting to Smartsheet requires an additional step, since OP3 supports dependencies with float time between tasks or milestones, while Smartsheet doesn’t allow dependencies with float time in between. For that reason, you can choose either to remove all dependencies or just those with float time only while exporting to Smartsheet.
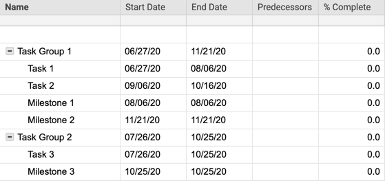
Smartsheet Export
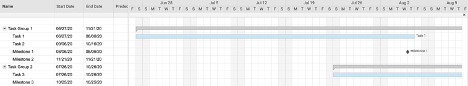
After the project is exported to Smartsheet, you will need to take additional manual steps in order to display the Gantt chart.
- 1. Edit Project Settings -> Dependencies Enabled
- 2. Use column ‘Predecessors’ to enable dependencies
- 3. ‘Predecessors’ and ‘Duration’ columns will be automatically detected
- 4. All milestones will be shown with a duration of 1d. To change those to milestones recognizable by Smartsheet, you need to change each milestone’s duration manually to 0 days.
Each data export requires 1 credit. Read more about credits in OP3 here.