Tutorials
Get started with OP3
Align with Previous Distribution Algorithm (AWP)
Whenever you decide to import a complex project into OP3, or create a project via Table view, OP3 needs a way to place the elements in the constrained one page plan – it will try to preserve the formatting of different elements while avoiding collisions between nearby tasks and texts of nearby tasks or milestones. This algorithm is performed in several steps. In this tutorial we assume that you are importing a new project from an Excel file, which can have up to 2000 rows.
Read more about importing into OP3 here
Calculate Rows for Items for Each Task Group
After importing a project into OP3, it’s analyzed for Task Groups, tasks, milestones and inner sub task groups, leading to a tree-like representation of the imported project. First level task groups will be rendered as task groups into OP3 – a maximum of 24 task groups are currently supported for swimlane templates, so if your imported project has more than 24 task groups, only the first 24 will be shown, while others will be marked as hidden on the Table view.
Based on the total number of task groups to show on the page, they are vertically distributed for producing a consistent view. Every task, milestone or sub task group within those task groups will be tried to be placed within the bounds of vertically distributed task groups. This means that not every task and milestone will fit in any case.
AWP algorithm tries to place as many items inside a task group based on their calculated importance. There are two options to achieve this:
1. All items fit in new rows
If all the tasks and milestones inside a task group can fit within the bounds of that task group if each task and milestone are placed in new rows, then the Next Row helper algorithm is applied. This places each task and milestone, in the definition order, in new rows.

2. All items don't fit in new rows
In the case where all items in a task group cannot be placed in new rows, then the AWP algorithm is applied. The rows for the items are calculated in the background using a top to bottom approach for analyzing items one by one.
The rule that is applied in this case is very simple: If the current item that is being analyzed doesn’t overlap with the previous item, place it in the same row, otherwise place it in a new row bellow.
For every sub task group, the first item is always placed in a new row. In this way, the algorithm can generate more rows than the supported number of rows inside a task group.
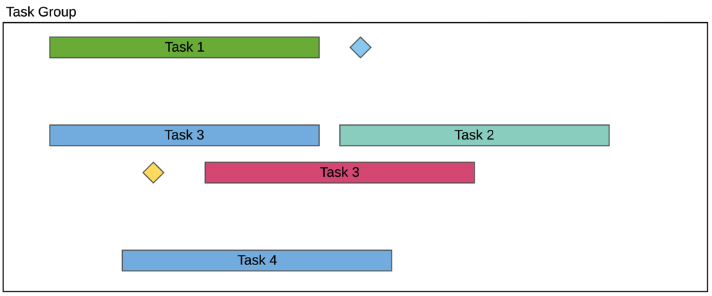
In that case, only N rows that can fit in a task group will be rendered, as shown in the following scenario, where only 2 rows can fit in a task group, while AWP has produced 4 rows.

AWP produces 4 rows, task group can accept only 2 rows
The rows that will be rendered inside the task group are chosen based on a Row Importance algorithm, that is explained bellow.
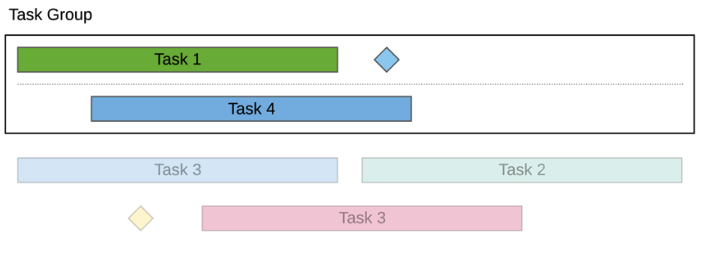
AWP places only 2 most important rows inside the task group
Row Importance Algorithm
Compared to MaxFit algorithm, where the first N row were selected to be placed inside a task group, AWP uses a more intuitive approach. Let’s consider the given scenario bellow, where AWP has analyzed the contents of a Task Group and has generated 6 rows.
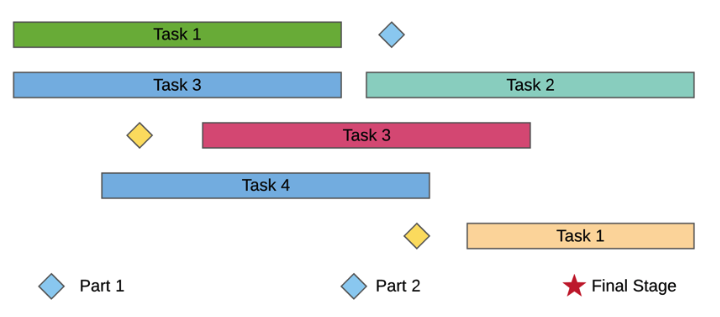
The Row Importance algorithm is only applied when the generated rows don’t fit inside the task group. For the given scenario, the task group can fit from 1 up to 5 rows, and the rows that will be shown depends on their importance. Assuming the rows are labeled with numbers from 1 to 6, the importance will be calculated like this:
6 -> 1 -> 5 -> 3 -> 4 -> 2
Another scenario would be for rows labeled with numbers from 1 to 5. In that case, the importance will be calculated like this:
5 -> 1 -> 3 -> 4 -> 2
Rows are sorted by importance in descending order. The goal of importance is to spread out the selection of rows as much as possible, while attaining some general rules:
- - The last row is the most important one
- - The first row is the next most important one
- - The second row is the least important one
This means that the last row is always the most important, since in most cases it contains a critical milestone that indicates the finalization of something. The next most important is the first row, since in most cases it indicates the start of an important activity. The following important rows are selected as far as possible from each other, leading to the second row always being the least important.
Having the overall Row Importance logic explained, let’s see what will be rendered inside a Task Group for the scenario that we are analyzing. We take into consideration use cases when the Task Group can fit 1, 2, 3, 4 and 5 rows respectively.

Task Group has space for 1 row

Task Group has space for 2 rows

Task Group has space for 3 rows

Task Group has space for 4 rows

Task Group has space for 5 rows
Board Distancing Algorithm
A milestone represents a significant event that doesn’t have any duration but takes space on the board – and it can be resized. Assuming you import a project using AWP distribution algorithm that has a long duration and several milestones are close to one another, the result would look like this:

Not very descriptive, right? Even if OP3 is highly intelligent in detecting milestones and placing them on the board, this representation is not desired for complex projects, since the milestones are visually overlapping, and the milestone name won’t be shown. That’s why OP3 goes one step further into polishing the entire plan by removing milestones that are very close.
It uses an algorithm known as Board Distancing algorithm, which analyzes milestones in every row, from right to left, and removes those milestones which are very close to the previous one. The outcome of this step is given bellow, and you can feel the difference.

Handling Text Collisions
This looks a bit messy, right? When importing a project into OP3, this is a possible scenario where the text of tasks or milestones can overlap either with other items or with task group bounds.

In OP3, that doesn’t happen. Text can be placed in several positions around the task’s or milestone’s shape: Center, Top, Bottom, Left and Right. You can easily change the text position of an item on the board, however, when importing a project, text collision is a common scenario. But you don’t have to worry at all since OP3 handles it automatically.
For the example above, the text of the first milestone, ‘Finalize Part 1’ doesn’t fit in the empty space on both left and right side of that milestone. That’s why it will be automatically hidden when a project is imported into OP3. The result can be seen bellow. Looks better, right?

After the import, you can easily turn the text on and place it on a position you may find suitable.
Vertical Distribution
We tried to think of every possible use case while importing a project (If you find a use case that we may have let slip, please let us know). One very common use case is when you import a project with just a few task groups, two or three, and there are just a few items in each task group, the result would look like this:
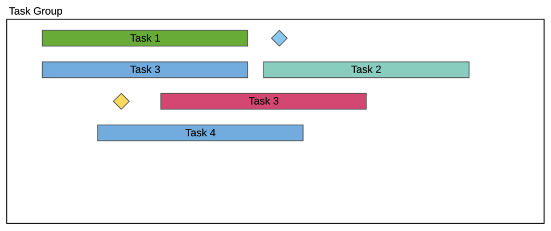
Looks good, but it can be much better. We applied vertical distribution of each row throughout the task group, in order to achieve a consistent and beautiful project plan, that would look like this:
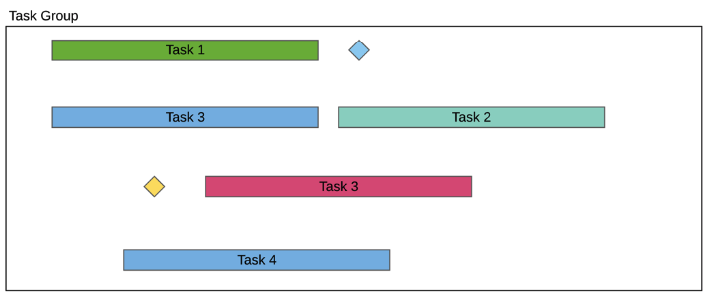
AWP goes one step further, by preserving the context of the sub task groups as well. It groups sub task groups close to one another when vertical distribution is applied. Assuming that the items in the two rows in the middle belong to the same sub task group, the result would look like this after the vertical distribution.
